
Now that the 2018 midterm elections have ended, a lot of analysis will begin about U.S. Latino voters and how they performed across different states and on a national level. Knowing that we will get more and more specific information in the future, we did want to at least some exit poll data about Latinos, both from the more mainstream National Election Pool (CNN, ABC, CBS and NBC) as well as from Latino Decisions’ Election Eve Poll, which LD did with Asian American Decisions and the African American Research Collaborative. This data does not cover every state that voted on Tuesday.
Here goes (graphics of National Election Poll are from CNN; the Election Eve Poll images are from Latino Decisions):
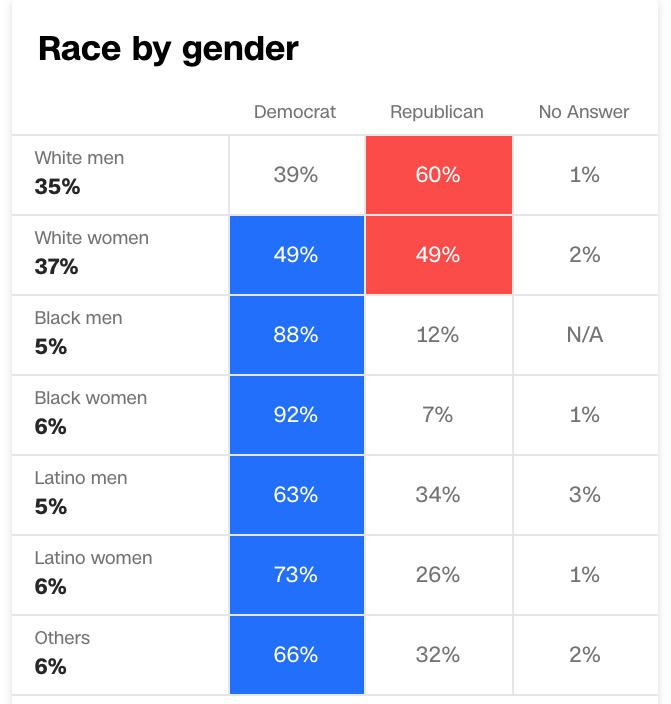
National Vote
National Election Pool
Latinos: 69% Democrat, 29% Republican

Latino men: 63% Democrat, 34% Republican; Latina women: 73% Democrat, 26% Republican
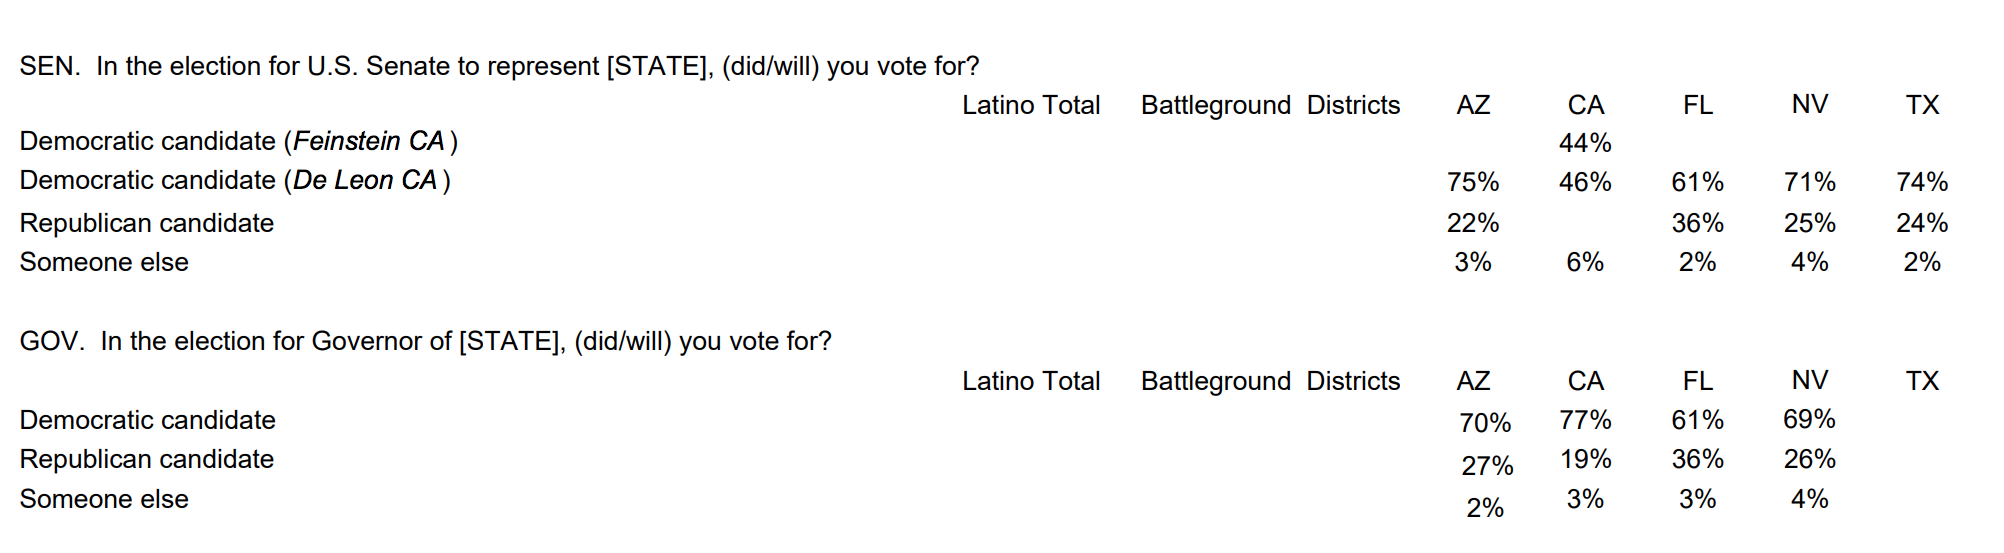
National Vote
Election Eve Poll
Latinos: 74% Democrat, 24% Republican (also see breakdowns by state: note that TX went Republican and FL will likely go Republican)

Florida Senate Race
National Election Pool
Latinos: 55% Democrat, 44% Republican

Latino men: 50% Democrat, 50% Republican; Latina women: 58% Democrat, 40% Republican
Florida Governor Race
National Election Pool
Latinos: 56% Democrat, 42% Republican

Latino men: 50% Democrat, 46% Republican; Latina women: 59% Democrat, 40% Republican

Florida Senate and Governor Races
Election Eve Poll
Latinos: 61% Democrat, 36% Republican (both races)

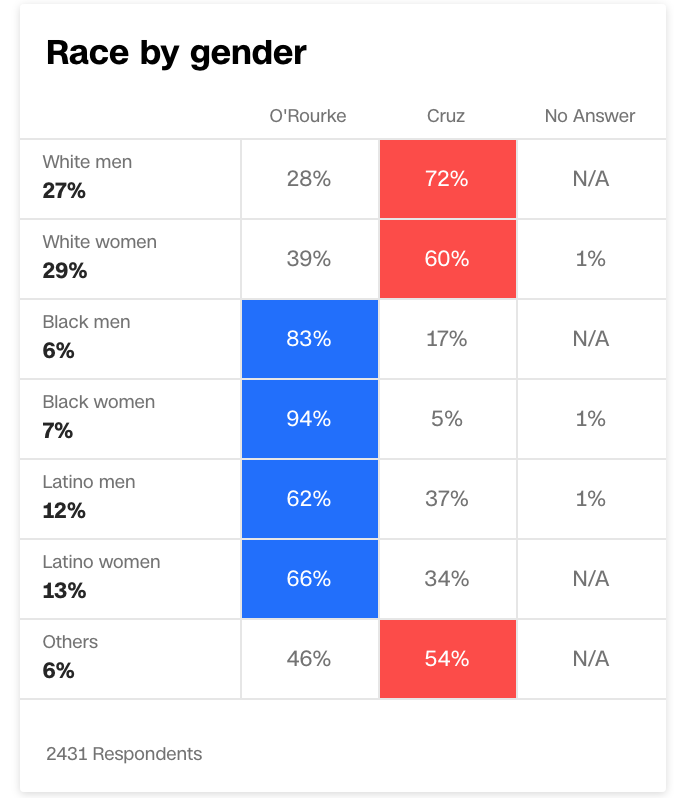
Texas Senate Race
National Election Pool
Latinos: 64% Democrat, 35% Republican

Latino men: 62% Democrat, 37% Republican; Latina women: 66% Democrat, 34% Republican
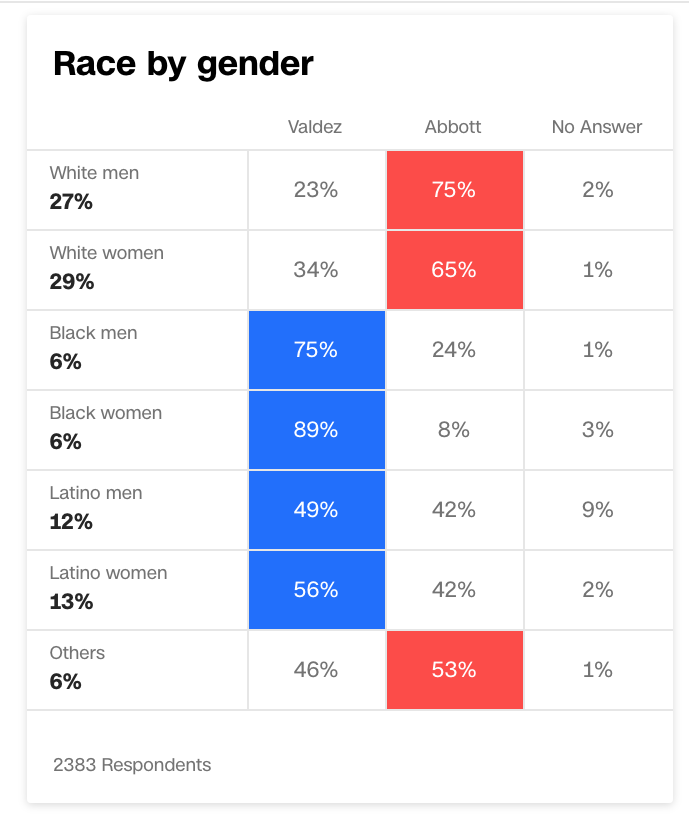
Texas Governor Race
National Election Pool
Latinos: 53% Democrat, 42% Republican
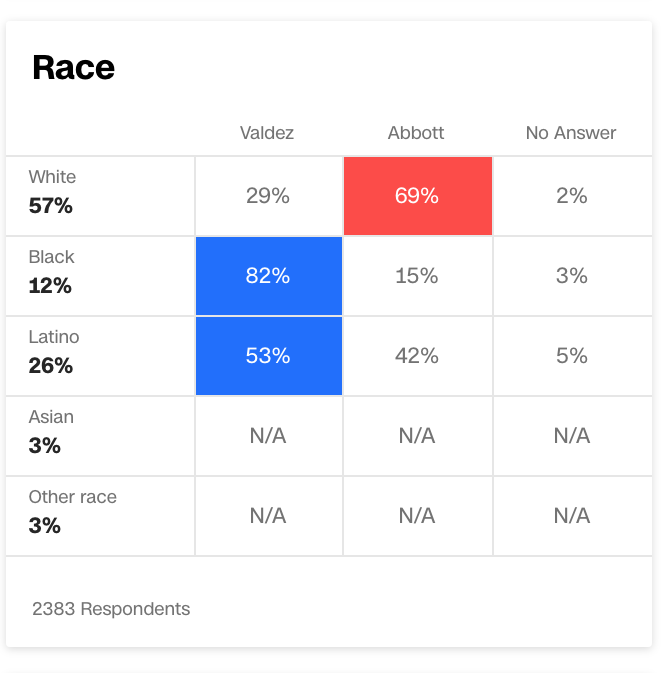
Latino men: 49% Democrat, 42% Republican; Latina women: 56% Democrat, 42% Republican
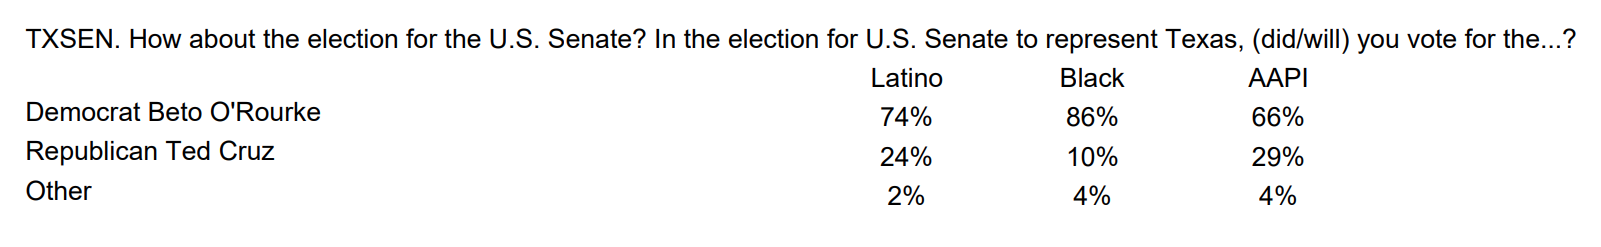
Texas Senate Race
Election Eve Poll
Latinos: 74% Democrat, 24% Republican
Arizona Senate Race
National Election Pool
Latinos: 69% Democrat, 31% Republican

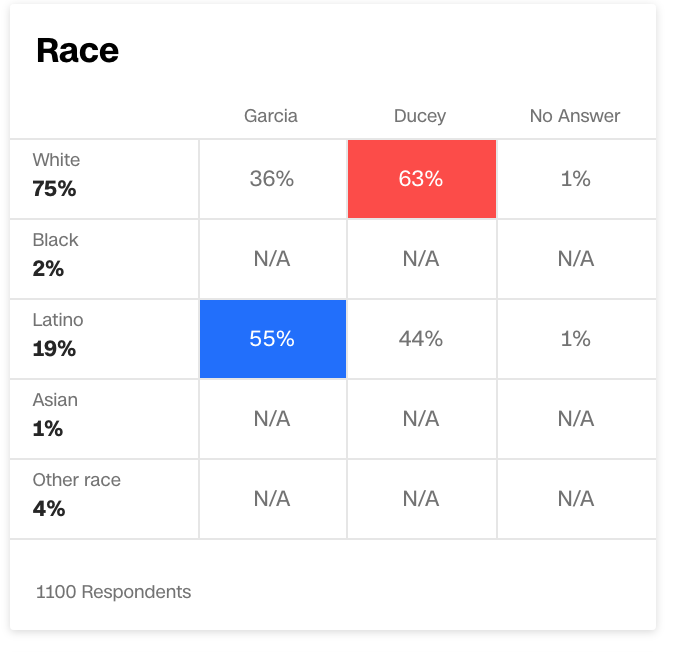
Arizona Governor Race
National Election Pool
Latinos: 55% Democrat, 44% Republican
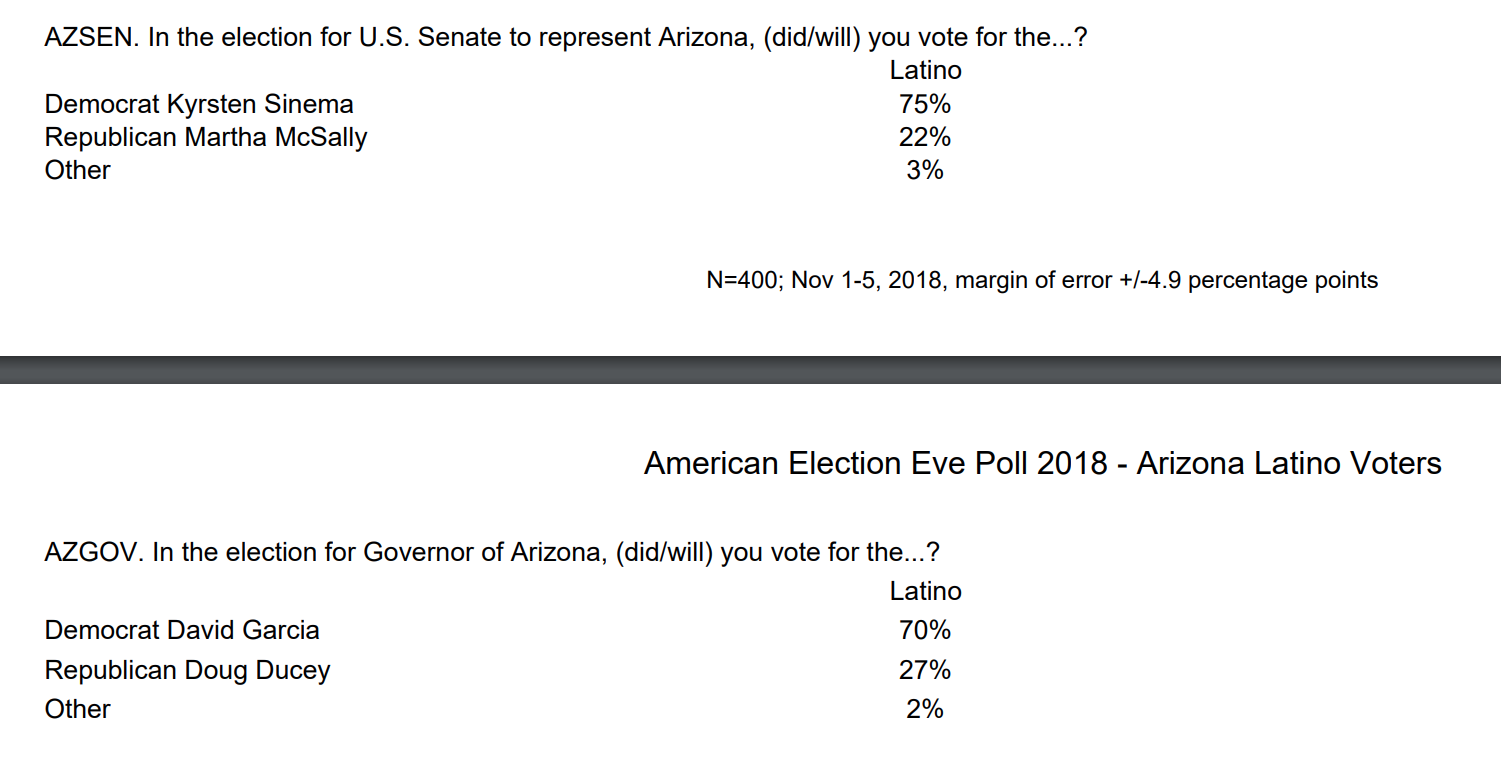
Arizona Senate and Governor Races
Election Eve Poll
Latinos: 75% Democrat, 22% Republican (Senate); 70% Democrat, 27% Republican (Governor)
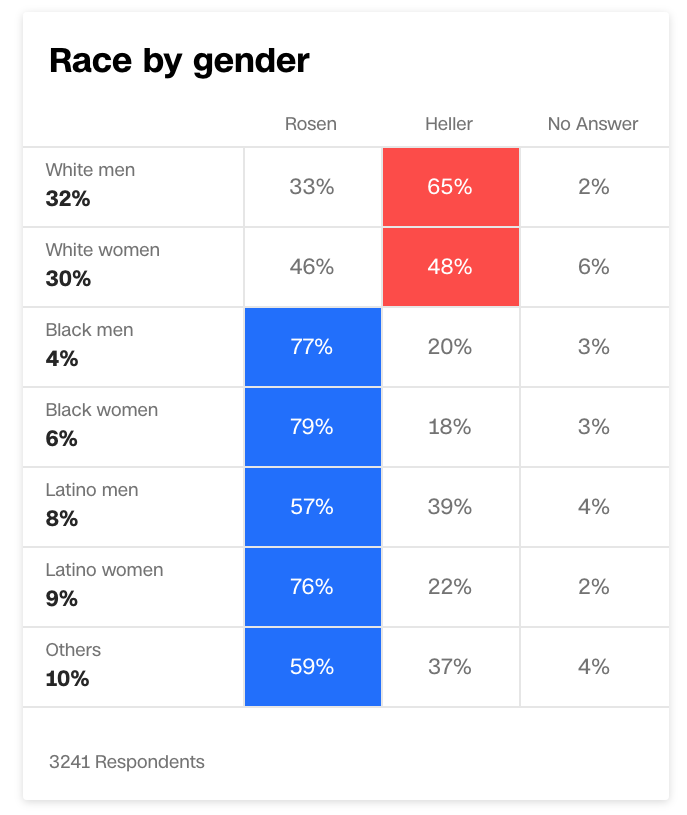
Nevada Senate Race
National Election Pool
Latinos: 67% Democrat, 30% Republican
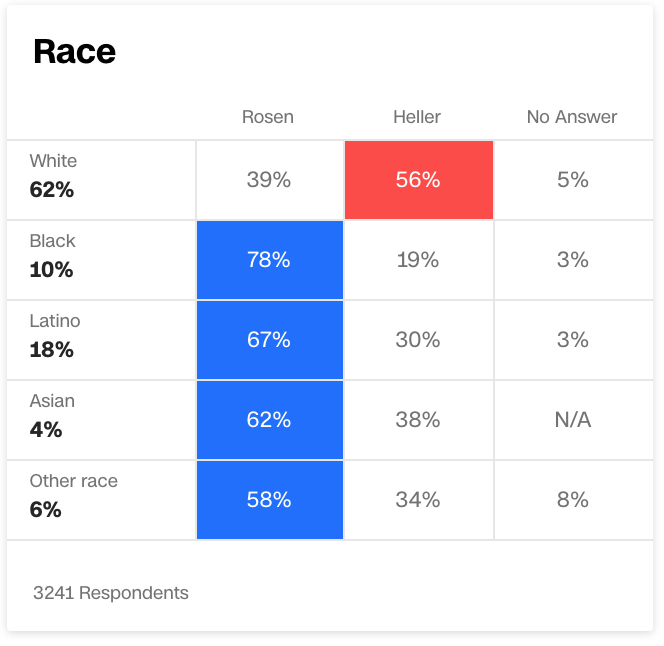
Latino men: 57% Democrat, 39% Republican; Latina women: 76% Democrat, 22% Republican
Nevada Senator Race
Election Eve Poll
Latinos: 71% Democrat, 25% Republican

Georgia Governor Race
National Election Pool
Latinos: 60% Democrat, 38% Republican

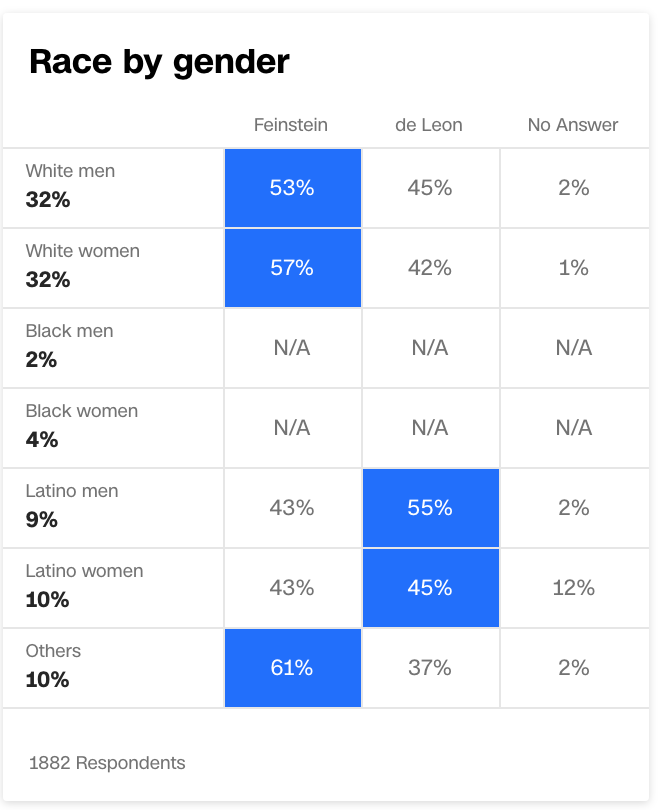
California Senate Race
National Election Pool
Latinos: 43% Feinstein (Democrat), 50% De León (Democrat)
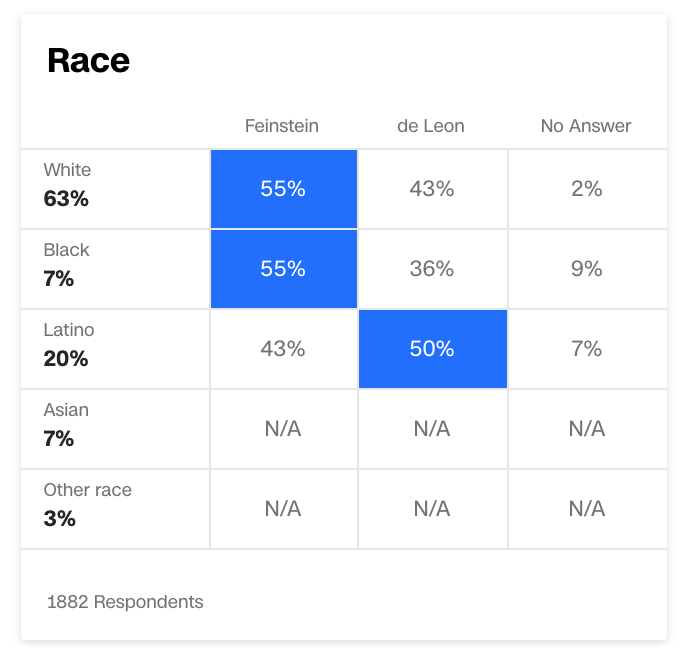
Latino men: 43% Feinstein (Democrat), 55% De León (Democrat); Latina women: 43% Feinstein (Democrat), 45% De León (Democrat)
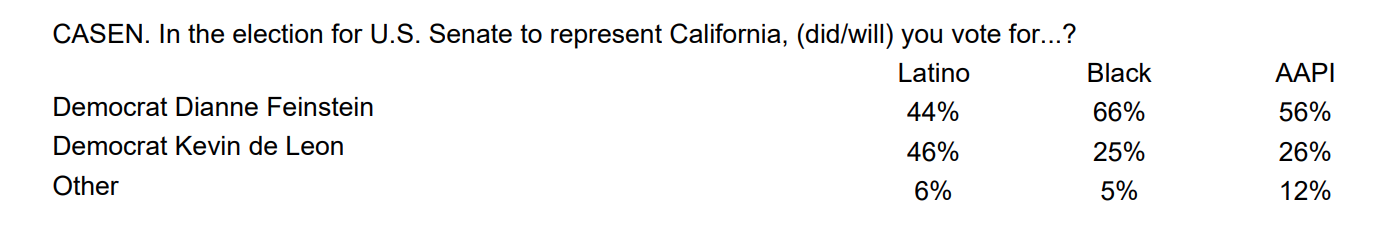
California Senate Race
Election Eve Poll
Latinos: 44% Feinstein (Democrat), 46% De León (Democrat)