
A campaign sign supporting former Joe Biden and Kamala Harris stands in front of a vote sign showing former President Barack Obama near the Clark County Election Department in North Las Vegas, Nev., Friday, November 6, 2020.(AP Photo/Jae C. Hong)
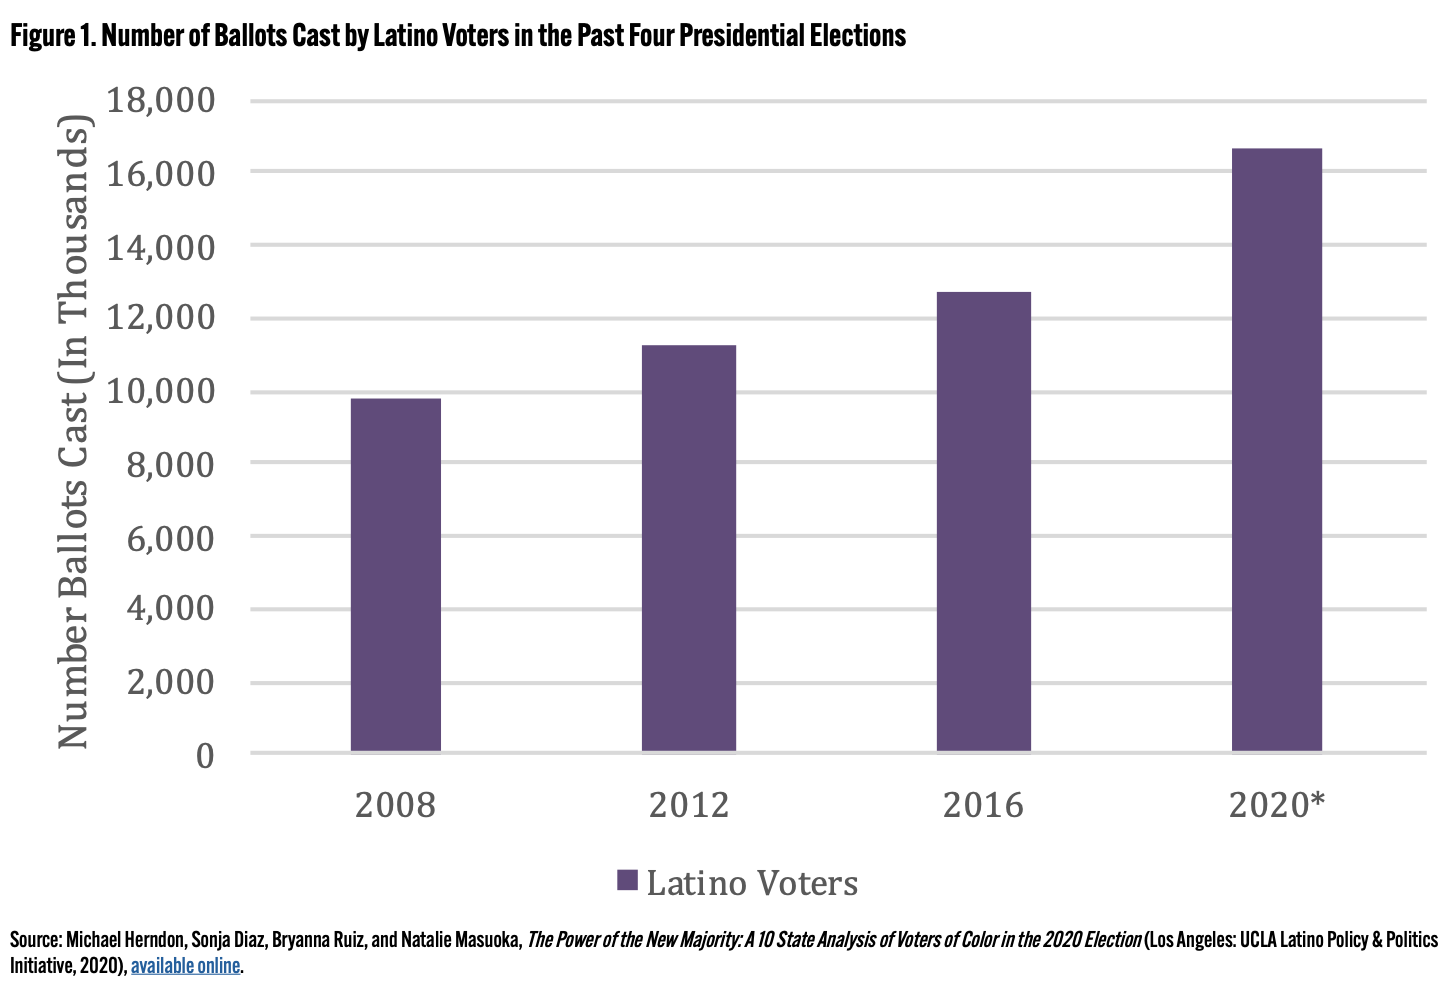
A study released this week by the UCLA Latino Policy & Politics Initiative (UCLA LPPI) estimated that a record 16.6 million U.S. Latinos voted in the 2020 national election —a 30.9% increase from 2016— resulting in key state victories for the Democratic presidential ticket of Joe Biden and Kamala Harris.
The 30.9% increase “was the single largest 4-year increase in Latino vote ever,” and “was nearly double the nationwide 15.9% growth in ballots cast between the 2016 and 2020 presidential elections,” the study noted.
“Latino vote growth was stronger and outpaced the national surge of voters in 2020. This is important because much of the national coverage of the Democrat-Republican vote split assumes a stagnate electorate with the same number of voters,” Dr. Matt Barreto, professor of Political Science of Chicana/o Studies and UCLA LPPI’s faculty director, told Latino Rebels. (In 2020, Barreto was hired by the Biden campaign to direct polling and focus group research for Latino voters. He stopped working for the campaign after the election.)
The historic turnout cited in the UCLA LPPI study played a role in several key states that the Biden-Harris ticket won, including Arizona, Georgia, Colorado, New Mexico, Nevada, Pennsylvania, and Wisconsin. An analysis of precincts in Arizona, Colorado, New Mexico, Nevada, Pennsylvania, and Wisconsin showed that Biden-Harris won U.S. Latino voters by a 3-to-1 margin in the race against Donald Trump and Mike Pence. In Georgia precincts, according to the study, Biden-Harris won by a 2-to-1 margin.
“We provide the most comprehensive analysis to date of how Latino voters, who are diverse across many geographies, voted in the 2020 presidential election,” Sonja Francine Marie Diaz, UCLA LPPI’s founding director. wrote in the study’s executive summary. “We analyze actual votes cast to better understand the electoral choices of Latino voters in 13 states that together account for over 80% of all Latino registered voters in the United States. By analyzing ballots cast rather than relying on exit polls, we reduce errors that emerge in exit interviews due to “small samples, unrepresentative selection of survey respondents, incomplete understanding of early and absentee voters, and language bias. Therefore, this report provides a unique contribution to understanding the Latino vote in 2020, unlike what has been published elsewhere.”
Here is a breakdown of key competitive states cited in the study—states all won by Biden-Harris, including four states that were close. According to final 2020 election results, Biden-Harris won Arizona by less than 10,500 votes, Georgia by less than 12,000, Wisconsin by less than 21,000 and Nevada by less than 34,000.
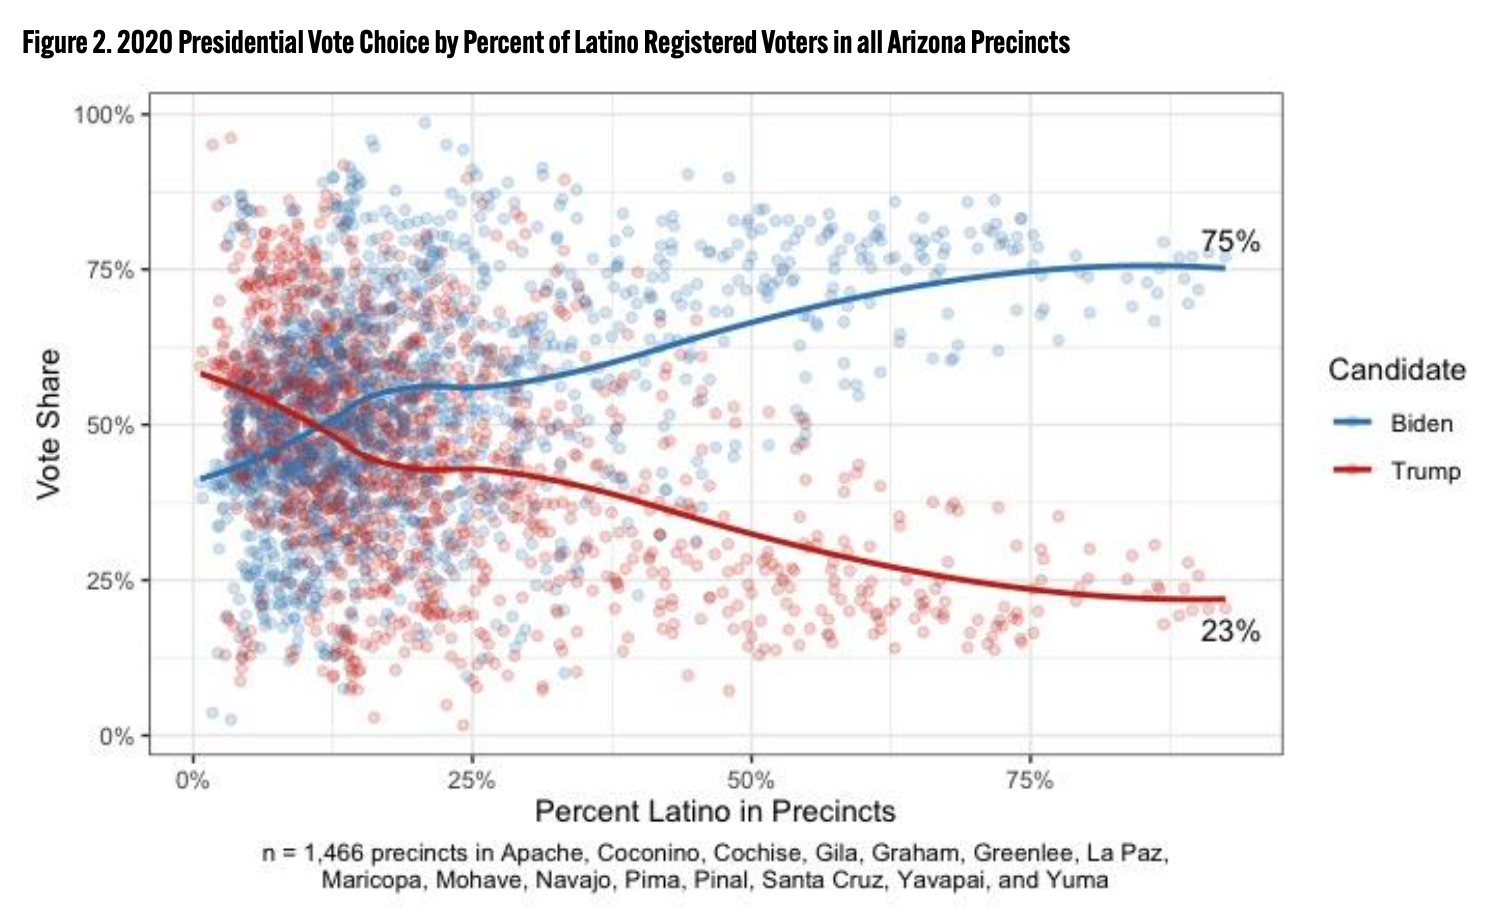
Arizona: “In high-density precincts, Biden received almost 74% of the votes, compared to the almost 46% support he received in low-density precincts. Precincts with less than 5% Latino voters favored Trump by a 7.8 percentage point difference.”
Colorado: “Voters in precincts with high concentrations of Latino voters (60% or higher) were more likely to vote for Biden over Trump: 79.4% and 18.4%, respectively. Voters in precincts with less than 5% Latino voters also favored Biden, but the difference in candidate preference is not as stark. 57.1% of voters in low-density Latino precincts voted for Biden, while 40.4% supported Trump.”
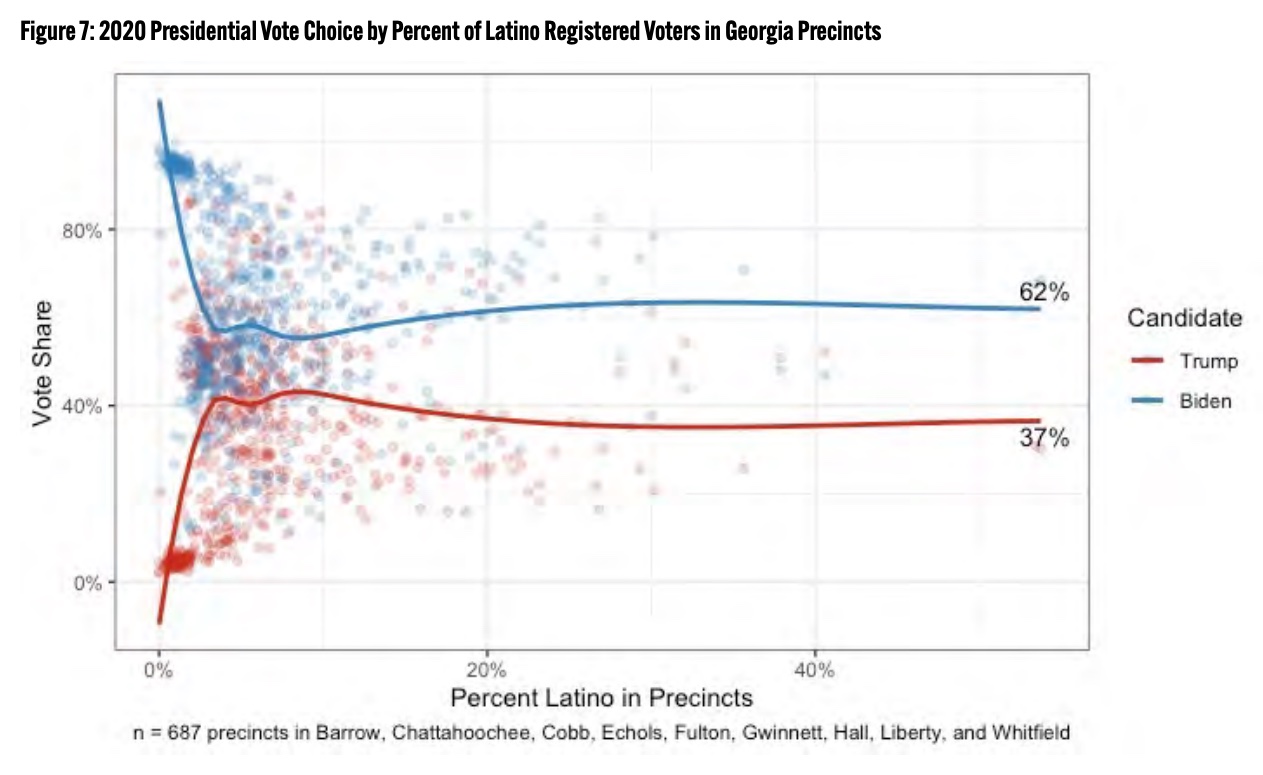
Georgia: “Voters in precincts with high concentrations of Latino registered voters (30% or higher) were more likely to vote for Biden over Trump: 59.2% and 39.1%, respectively. Voters in precincts with less than 2.5% Latino voters, which have large concentrations of African Americans, also favored Biden, with a much greater difference in candidate preference: 79.3% of registered voters in low-density Latino precincts voted for Biden, while 19.9% supported Trump.”
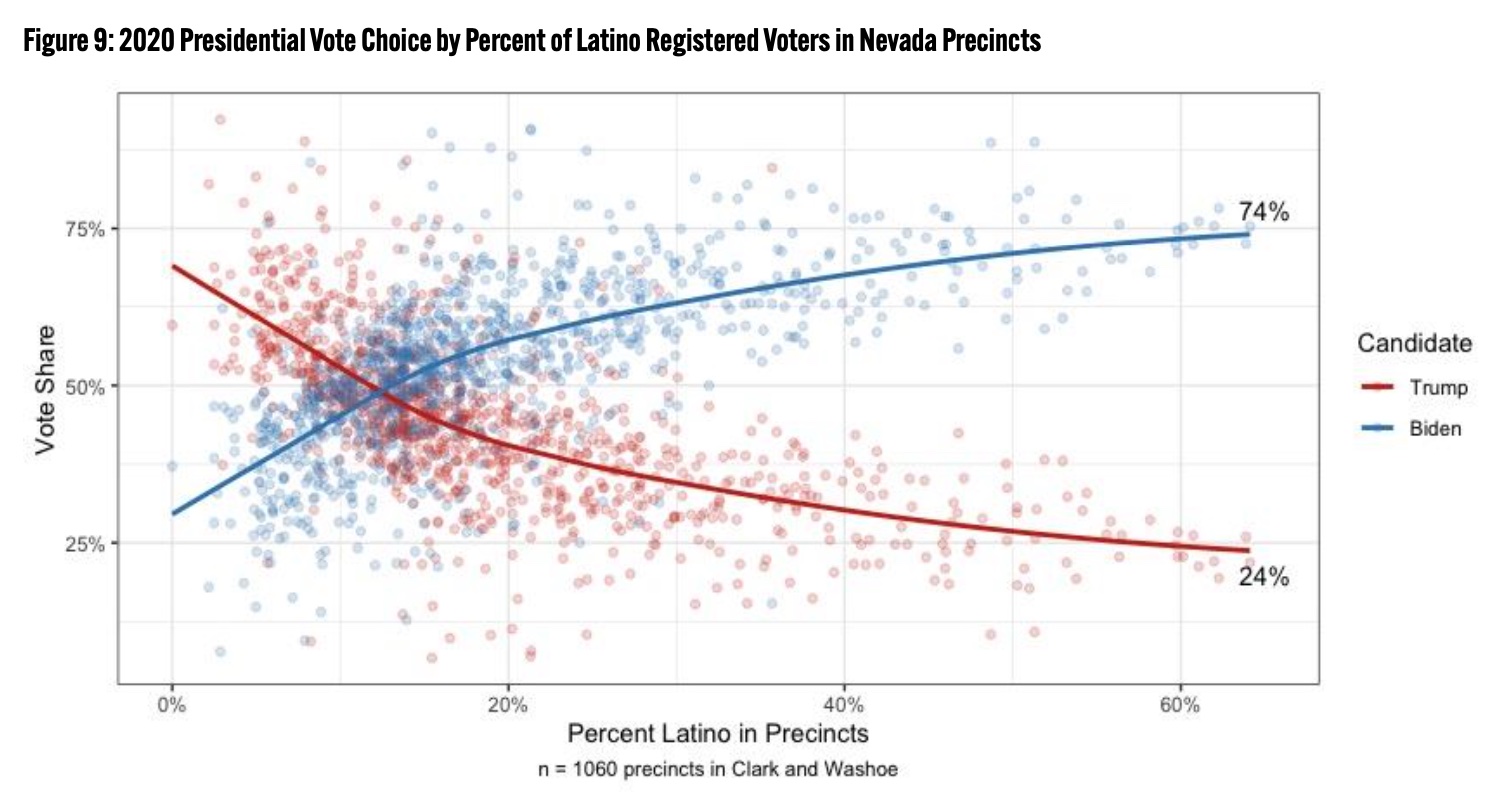
Nevada: “Voters in precincts with high concentrations of Latino voters (60% or higher) were more likely to vote for Biden over Trump: 75% and 22.8%, respectively. In contrast, voters in low-density precincts, (10% Latino or less), favored Trump over Biden by more than 17 percentage points (57.6% for Trump vs. 40.5% for Biden).”
New Mexico: “Voters in high-density precincts (75% Latino registered voters or more) favored Biden with 70.5% of the vote, while only 59.2% of the voters in low-density Latino precincts (less than 15% Latino) supported Biden.”
Pennsylvania: “Voters in precincts with high concentrations of Latino registered voters (70% or higher) were more likely to vote for Biden over Trump: 82.6% and 16.7%, respectively. Voters in precincts with less than 2.5% Latino registered voters also favored Biden. 61.1% of registered voters in low-density Latino precincts voted for Biden, while 37.7% supported Trump.”
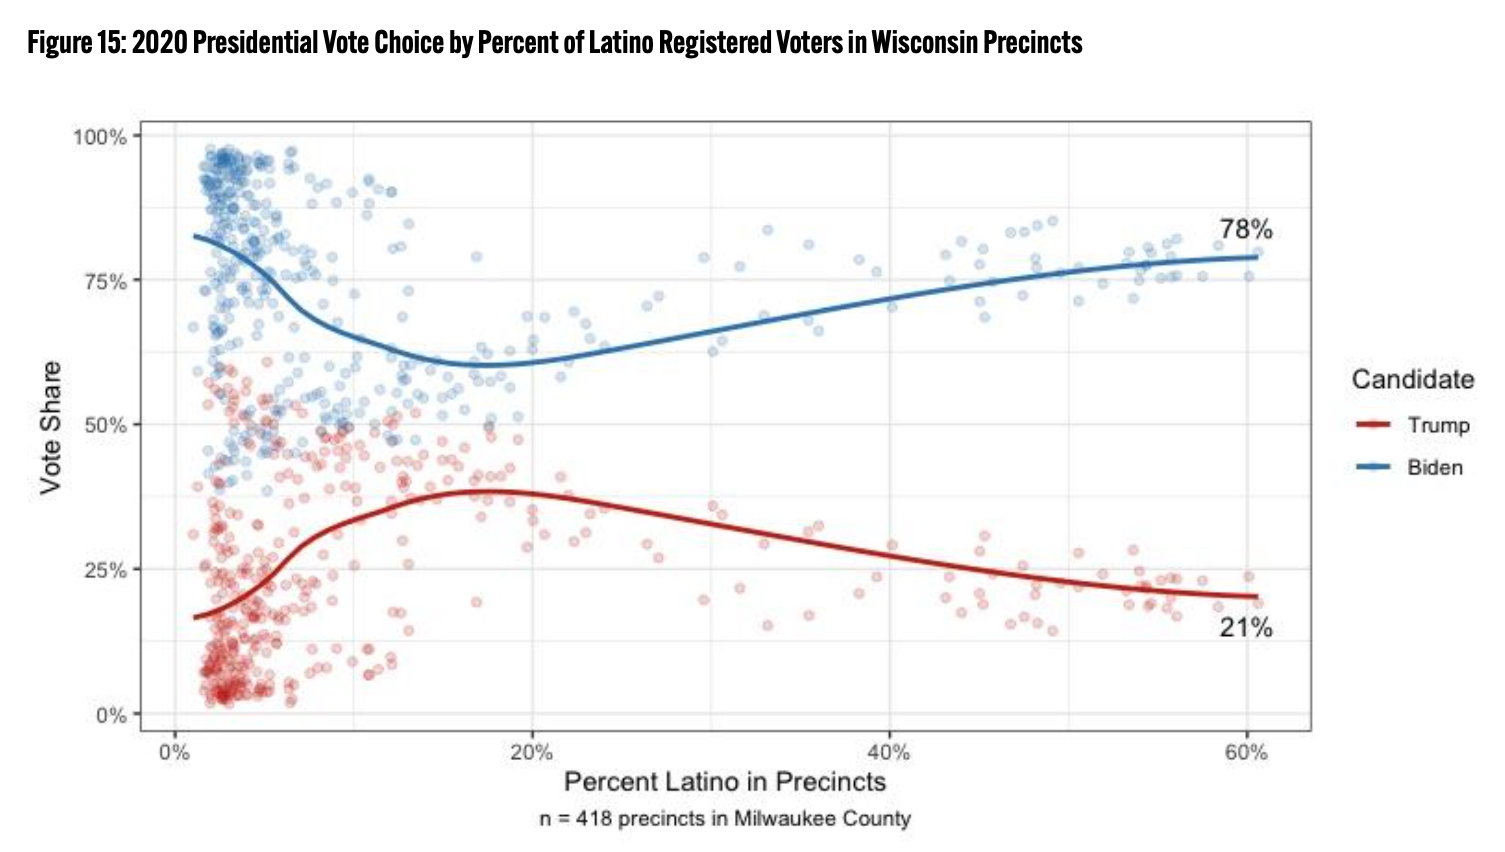
Wisconsin: “Voters in precincts with greater than 50% Latino registered voters were close to four times as likely to vote for Biden (77.3%) than for Trump (21.7%). The difference is even greater in precincts with less than 5% Latino voters: 80.3% of voters supported Biden, with a 61.9 percentage point difference in support of Trump.”
“Overall, when taking both increased turnout and steady vote for the Democratic ticket, Latino voters were a critical part of the coalition which elected Biden and Harris,” Barreto said, noting that the increased turnout led to even stronger support than what he thinks political pundits have been reporting.
He used the following example to make his point.
“Let’s say you won 75% to 25% and there were 1,000 voters. The net contribution to your bottom line is 500 plus voters. If in the next election, you won by only 70% to 30% —a 10 point net shift not in your favor— but the turnout was now at 1,500 voters, the net contribution to your bottom line is still 600 plus voters, which is greater than the plus 500 voters from the previous election. News headlines might read, ‘Latino voters shift 10 points away, big problem,’ when the reality is that majority support coupled with growth in turnout actually made Latino voters more valuable to the candidate. That is what happened in 2020.”
“Yes, there was a drop-off in the Latino vote share for Biden as compared to Hilary Clinton,” Barreto added. “However, it is important to put that into perspective—2016 represented a year when Clinton did particularly well and Trump did particularly poorly with Latinos. In 2020, the vote reverted back to a fairly normal trend of about two-to-one or close to 70-30 vote for Democrats. So while there was a drop-off, it is not a ‘sky is falling’ drop-off to incite panic. Instead, our 13-state data shows different patterns across different states to provide clues as to where each party needs to work harder, invest more and mobilize Latinos to earn their votes.”
The study also contained an analysis of precincts in the following states: California, Florida, Illinois, New York, Texas and Washington. Of these six states, Biden-Harris won four of them (CA, IL, NY, WA) and Trump-Pence won two (FL and TX). Here is a breakdown of those states cited in the study:
California: “Voters in precincts with high concentrations of Latinos (85% Latino or higher) were more likely to vote for Biden over Trump: 79.0% and 17.2%, respectively. Though voters in precincts with less than 15% Latino voters also favored Biden, the difference in candidate preference is much smaller than the difference in high-density Latino precincts. 58.4% of voters in low-density Latino precincts voted for Biden, with a 20.3 percentage point difference in support of Trump.”
Florida: “In high-density Latino precincts in Miami-Dade (80% Latino or more), Trump received 61.1% of the votes, on average. This stands in sharp contrast with precincts with less than 15% Latino voters, where Trump only received 10.9% of the vote.
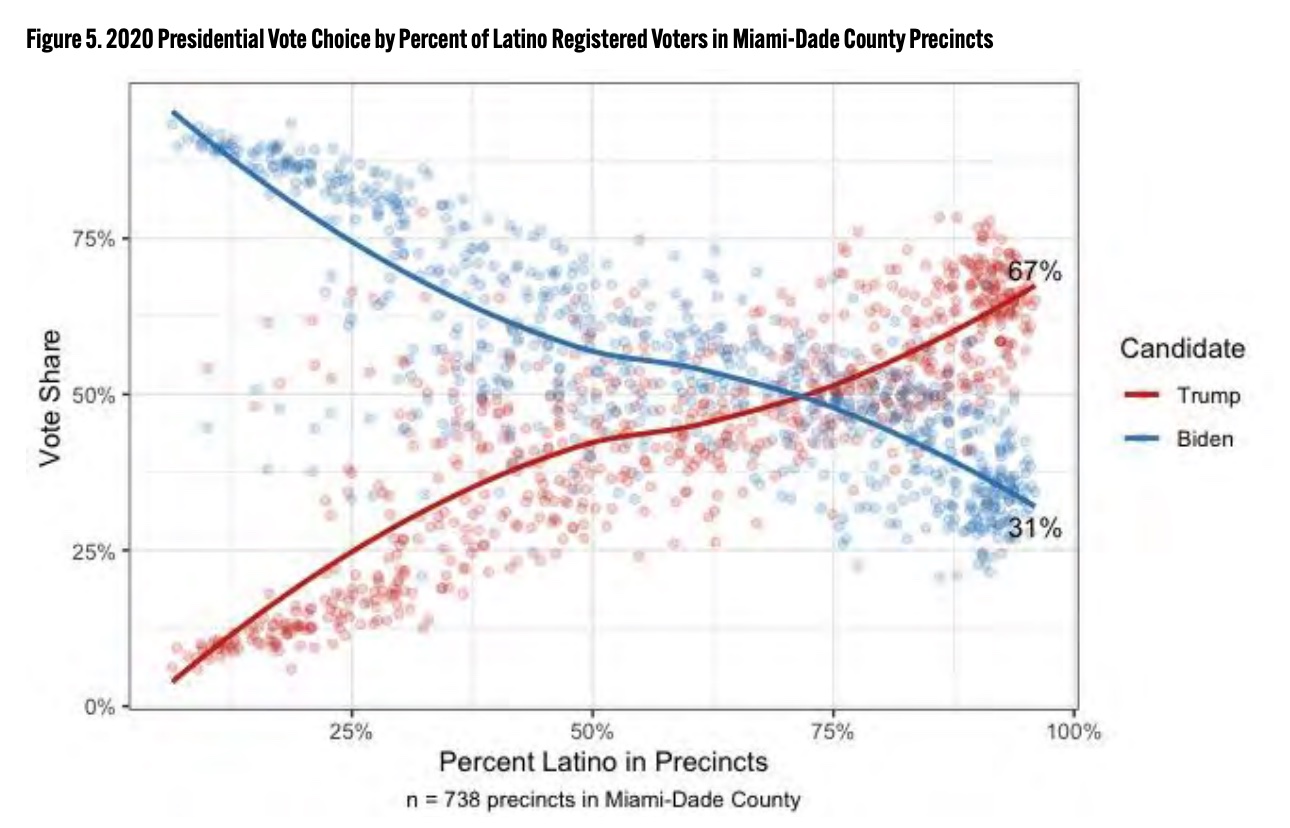
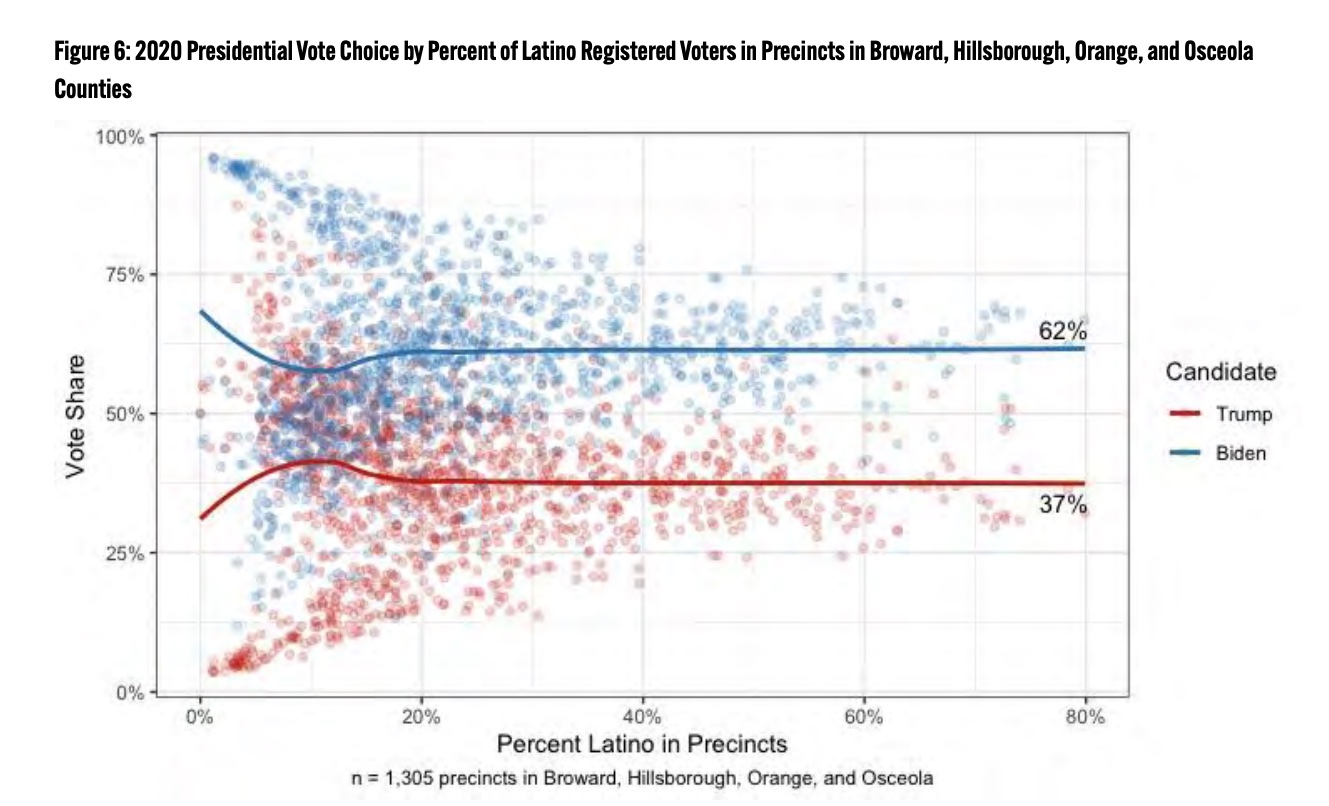
Outside of Miami-Dade, Biden received a higher share of the votes in high-density precincts than in low-density precincts. In precincts where Latinos comprise 70% or more of the total vote share, 63% of the votes cast went to Biden; in precincts with less than 15% Latino voters, 58% of ballots cast were for the Democratic candidate.”
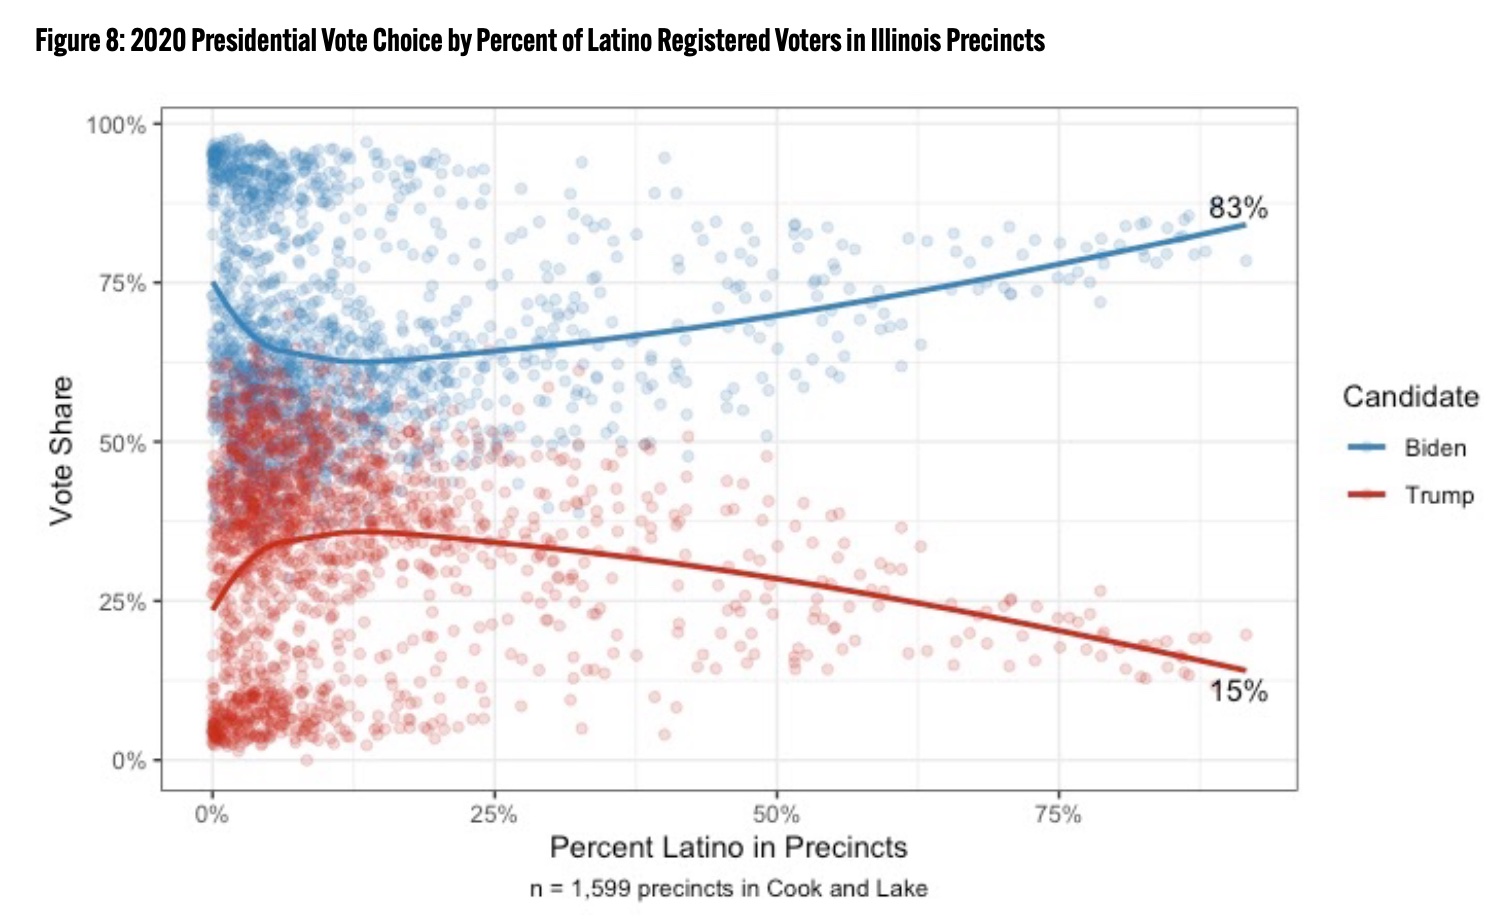
Illinois: “precincts with high concentrations of Latino voters (75% or higher) were more likely to vote for Biden over Trump: 80.5% and 17.7%, respectively. Voters in precincts with less than 5% Latino voters also favored Biden, but the difference between the two candidates is smaller: 68.7% of voters in low-density Latino precincts voted for Biden, while 29.9% supported Trump.”
New York: “Voters in high-density precincts (where 70% or more of registered voters are Latino) supported Biden in higher proportions than voters in low-density precincts (10% or less Latino). In high-density precincts, Biden received 76.7% of the votes compared to the 62.8% he received in low-density precincts.”
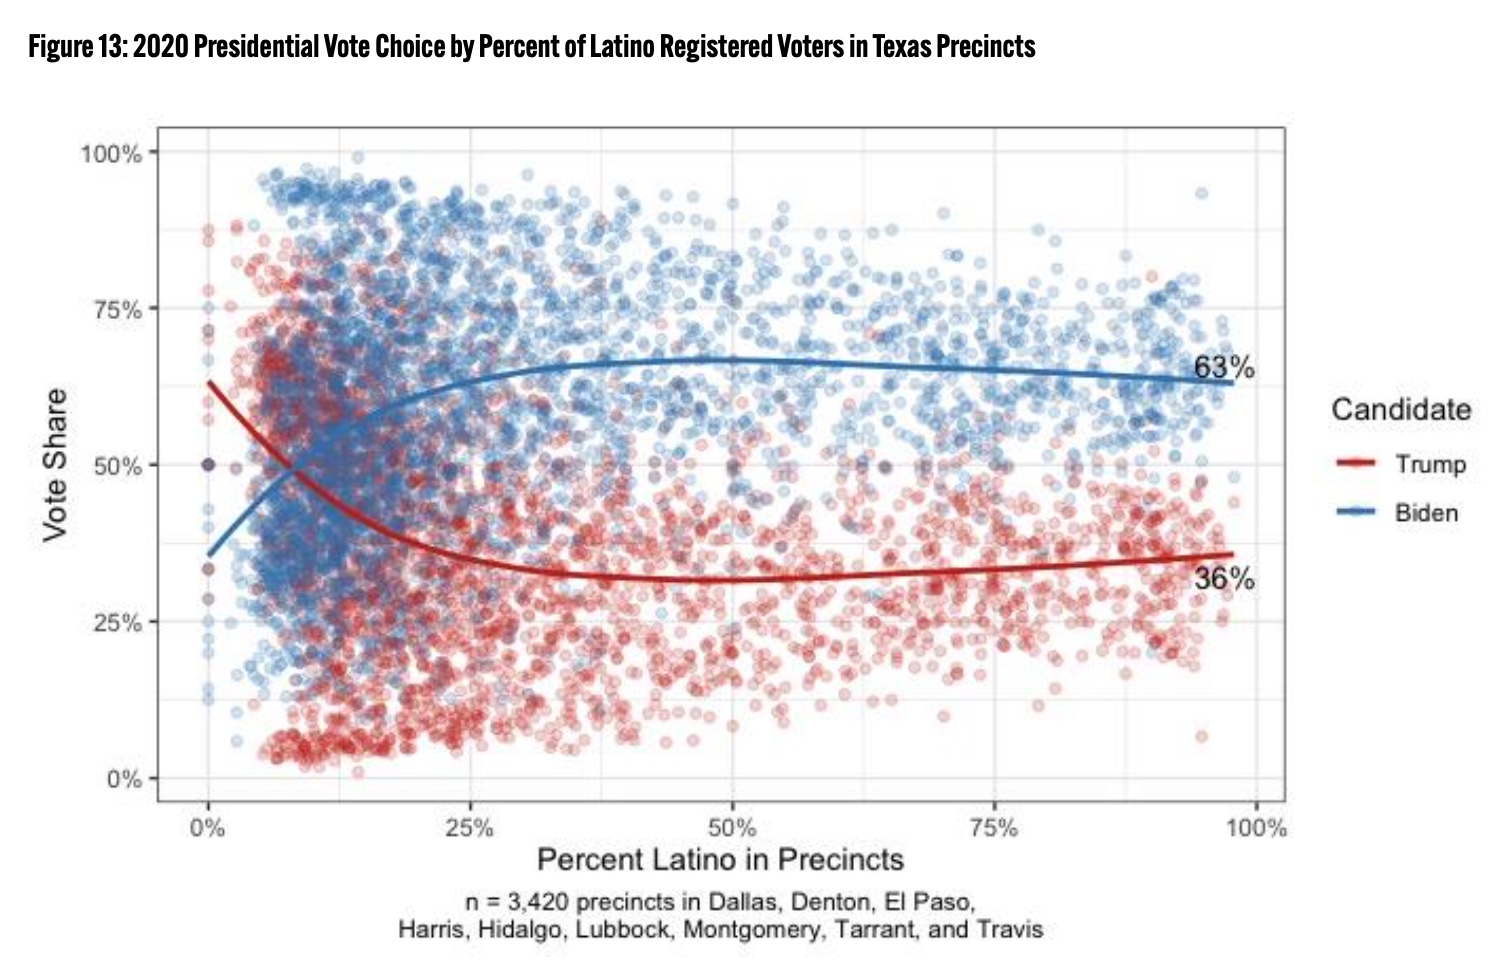
Texas: “Voters in precincts with greater than 85% Latino registered voters were nearly twice as likely to vote for Biden (64.1%) than for Trump (34.5%). In contrast, voters in precincts with less than 10% Latino voters were slightly more likely to vote for Trump (50.5%) than for Biden (47.9%).”
Washington: “Voters in high-density precincts (where 60% or more of registered voters are Latino) supported Biden in higher proportions than voters in low-density precincts (10% or less Latino). In high-density precincts, Biden received 61.3% of the votes. In contrast, almost the exact opposite occurred in low-density precincts—Trump received 63.4% of the votes.”
“As results for the presidential election started to pour in on November 3, 2020, the focus of the popular media on Latinos in Miami-Dade County created an incomplete narrative: Latinos delivered the state of Florida to the Republican candidate, Donald J. Trump. Exit polls with small Latino samples that showed a slight shift in Latino voter preference towards the Republican party relative to 2016 reinforced that narrative,” Diaz wrote in the UCLA LPPI executive summary. “After all, Miami-Dade represents only 3.1% of the overall U.S. Latino population and is not typical or representative of Latinos nationwide. An inaccurate and one-dimensional account of the vote choice and the impact of the second-largest ethno-racial voting bloc in the country emerged that night. But zooming out from Miami-Dade, the vote choice of Latino voters across the country paints a very different picture.”
“Rather than fixate on results in just one locale, we have taken a very comprehensive approach that incorporates Latino voters across 13 states and more than 27,000 individual precincts, which represents more than 40 million votes cast in these precincts,” Barreto said, noting that there has been a media fixation with Miami or south Texas and less of a holistic look at U.S. Latino voters in the 2020 election. Adding voting patterns in precincts from Arizona, California, New York, New Mexico, Wisconsin and other states, Barreto said, “made it more comprehensive and more representative.”
Barreto also added that U.S. Latino voters are diverse by age, immigrant status, country of origin, and state and local geography.
“We do not believe white voters in Vermont or West Virginia are somehow representative of all white voters, and we should understand Latino voters through a similar lens of diversity,” he said.
According to Diaz’s executive summary, such diversity can lead to more political power for Latinos.
“Latinos are youthful and diverse, and projected to make up 27.5% of the American population by 2060. This translates into immense political power as more of that population grows into the electorate,” Diaz wrote. “In November 2020, Arizona showed just what that power could result in when Latinos act as a concentrated voting bloc, clenching victory for Joe Biden and flipping their second Senate seat blue in just two years. Further, in states like Georgia, the small but growing Latino electorate was part of a large, Black-led multi-racial coalition that added to Democrats’ winning margins in both the 2020 presidential election as well as the two Senate runoffs.”
“Yet, Latinos are often left out of the conversation when it comes to shaping policy and are seen as an afterthought when it comes to elections. But as the challenges of 2020 showed us, elections have consequences and cost lives,” Diaz added.
Recently, the New York Times conducted an analysis of immigrant-majority precincts, saying that Trump increased support in these areas, particularly with Latinos. Such findings would contradict some of what the UCLA LPPI study found. According to Barreto, the Times analysis is not reflective of what actually happened with U.S. Latino voters during the 2020 election.
“The New York Times analysis misses the point of the larger historical context and ignores the changing denominator—for instance, that voter turnout went way up between 2016 and 2020,” Barreto said. “First, in terms of historical context, 2016 was a year in which Clinton did very well with immigrant and Latino voters. She was well-known and liked, and Trump portrayed himself as entirely anti-immigrant in 2016. So using 2016 as a mythical ‘baseline’ is completely misguided by the Times. When you look at longer trends over time in Latino and immigrant voting, the Democrats continue to make gains and win around a 2-to-1 margin, sometimes more, in immigrant communities. In 2020, Trump was able to get the entire Republican Party back in his camp, including people like Marco Rubio, who is well-known by Spanish-speaking voters, which helped him grow his support over 2016. But Trump in 2020 was still far below the high mark of 38%, which George W. Bush won with Latinos in 2004.”
“The Times analysis also mixes Latino, Asian, African and other immigrant communities, and continues the narrative that all Latinos are immigrants,” Barreto said. “Our [UCLA LPPI] analysis looks at Latino voters—whether they are newly naturalized citizens, newly arrived from the island of Puerto Rico or if their family has been in the U.S. for over 100 years. We are looking at the whole of the Latino electorate.”
The lack of understanding from the Times analysis is yet another example of why Barreto has urged political journalists and data experts to start “talking more about Latino ‘voters’ and not ‘the Latino vote.'”
“They need to report on Latino voters with the same nuance and complexity that political media give white voters. Give some time to take a more comprehensive and holistic approach. Don’t get distracted by one or two anecdotes that may or may not be representative of our community. The Latino vote is going to continue to grow and become a larger and larger share of the overall national electorate, and so coverage of the Latino voting community should continue to grow in importance,” Barreto said.
The complete UCLA LPPI study is here.
***
Julio Ricardo Varela is founder and publisher of Latino Rebels, part of Futuro Media. He tweets from @julito77.
[…] In 2016, about 12.65 million Latinx voters turned out to vote. In 2020, that number increased to an estimated 16.6 million, according to a new UCLA study published this week. […]
[…] this week, a data report by the UCLA Latino Policy & Politics Initiative (LPPI) estimated that a historic 16.6 million […]
[…] Biden’s decision to propose immigration reform on his first day indicates that he knows that a record-breaking turnout of Latino voters delivered states like Arizona to him. Could the Biden administration tap into that energy and […]
[…] Biden’s choice to suggest immigration reform on his first day signifies that he is aware of that a record-breaking turnout of Latino voters delivered states like Arizona to him. Could the Biden administration faucet into that power and […]
[…] many observers of Latino voters have been saying for years—the growing Latino electorate, which experienced a historic turnout last year, is still very persuadable because there is very little overall outreach investment in the […]
[…] in the interview, Maher was asking Padilla about why Donald Trump did better with Latino voters (a complicated topic that needs more studies). Maher then cited a November 4, 2020 tweet by Rep. Ruben Gallego (D-AZ) […]
[…] An analysis of precincts by the UCLA Latino Policy & Politics Initiative in Arizona, Colorado and New Mexico showed that President Biden won U.S. Latino voters by a 3-to-1 margin in the race against former President Trump. […]
[…] An analysis of precincts by the UCLA Latino Policy & Politics Initiative in Arizona, Colorado and New Mexico showed that President Biden won U.S. Latino voters by a 3-to-1 ratio in the race against former President Trump. […]
[…] this year, a 2020 postmortem by Equis Labs concluded that the growing U.S. Latino electorate, which experienced a historic turnout, is still very persuadable due to very little overall outreach investment in the […]
[…] Latino voters, but that Democrats are getting a smaller share of Latino support, even as Latinos continue voting in record numbers. The apex of Latino support was in 2012, when Barack Obama earned 71 percent of […]
[…] Latino voters, but that Democrats are getting a smaller share of Latino support, even as Latinos continue voting in record numbers. The apex of Latino support was in 2012, when Barack Obama earned 71 percent of […]