
AP Photo/Eric Gay, File
“Democrats lead Republicans by more than 20 points among Latino voters, but that Democratic advantage has declined from previous election cycles,” concludes a new NBC News/Telemundo poll released on Sunday.
A deeper look into the poll, which surveyed 1,000 Latino respondents, reveals some takeaways that reflect just how complex the Latino vote in 2022 really is:
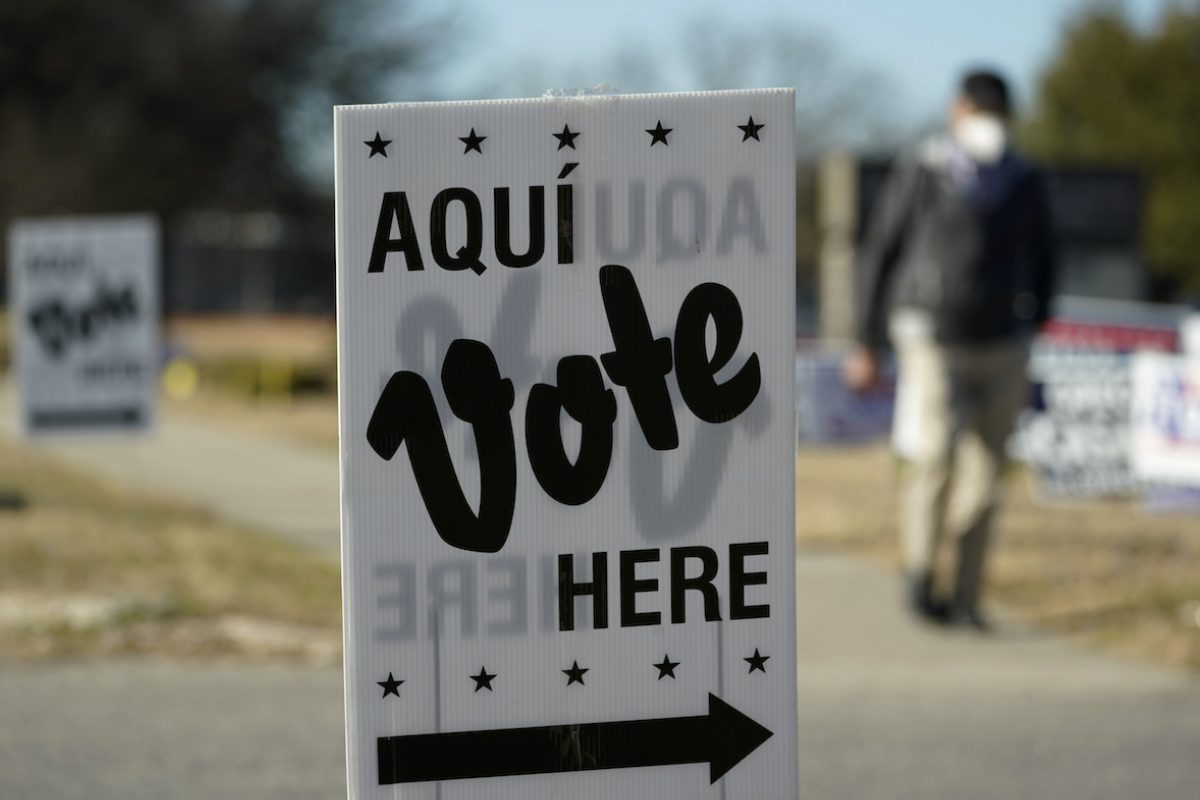
- Seventy-five percent of respondents preferred to answer the survey in English, confirming recent market data that reveal similar trends. As one report from earlier this year noted, “With 72% of Latinos now preferring content in English, that leaves just 28% who prefer content in Spanish, and that number is shrinking.”
- Almost half of the Latino respondents identified as white. The exact number is 45 percent, with 26 percent choosing “Hispanic,” 25 percent picking “Other,” and three percent selecting “Black/African American.” The results for “Asian” didn’t register a percentage. Such findings tend to go against 2020 Census data, which noted that “among people of Hispanic or Latino origin, 26.2 million people (42.2%) identified their race as Some Other Race alone, a 41.7% change from 2010,” and that “the number of people of Hispanic or Latino origin who identified as White alone decreased by 52.9%, down from 26.7 million to 12.6 million over the decade.”
- Twenty-eight percent of respondents identified closer to an Independent category. Combined, 42 percent fell into the Democratic category, with 23 percent in the Republican category. Of those who identified as either a strong Democrat or not-so-strong Democrat, 28 percent said they would have thought of themselves as an Independent or Republican. Conversely, 26 percent of strong or not-so-strong Republicans felt the same way. In short, Latino voters are still very persuadable.
- Fifty-seven percent of respondents said the country is headed in the wrong direction. In 2020, that number was 59 percent—up a percent from 2018.
- President Biden’s 51 percent approval rating hasn’t changed since 2020. In 2015, when he was a presidential candidate, his approval rating was 15 percent.
- Fifty percent of respondents view the Republican Party negatively, passing the 50 percent threshold for the first time since 2016, when Republicans got a 57 percent negative rating. Democrats’ negative rating stands at 34 percent, the highest negative rating since these types of polls began in 2008. In 2016, Democrats’ negative rating stood at just 16 percent.
- Twenty-three percent of respondents gave socialism a positive rating, while capitalism got a 44 percent positive rating.
- The top issues for respondents are: cost of living (43 percent), jobs and the economy (35 percent), threats to democracy (26 percent), immigration and the situation at the border (25 percent), climate change (15 percent), guns (15 percent) and abortion (14 percent). However, when asked about which issue they felt would motivate them most to vote against a specific candidate, the order was as follows: abortion (24 percent), guns (17 percent), border security (16 percent), immigration (13 percent), climate change (11 percent).
- Close to 60 percent of respondents said that “border security” was the more important issue when asked to choose between it and “immigration.” Only 35 percent chose “immigration,” with 59 percent choosing “border security.” In addition, 44 percent of respondents said the border was not secure, and 46 percent said it was.
- Just 33 percent of respondents said President Biden’s economic policies have helped them. Conversely, 39 percent of respondents said Biden’s policies have hurt them, with 26 percent saying that they have made no difference.
The full poll is below.
***
Julio Ricardo Varela is the president of Futuro Media and founder of Latino Rebels. He also co-hosts the In The Thick political podcast and is an MSNBC Opinion Columnist. Twitter: @julito77
[…] post 10 Takeaways of NBC News/Telemundo Poll Reveal How Complex Latino Voters Really Are appeared first on Latino […]